| Project | Podhorce_mapa_1 |
| Processed | 2017-07-13 11:21:27 |
| Camera Model Name(s) | FC6310_8.8_5472x3648 (RGB) |
| Average Ground Sampling Distance (GSD) | 2.66 cm / 1.05 in |
| Area Covered | 0.2169 km2 / 21.6873 ha / 0.0838 sq. mi. / 53.6181 acres |
| Time for Initial Processing (without report) | 04h:29m:29s |
Quality Check |
| Images | median of 68612 keypoints per image |  |
|
| Dataset | 282 out of 282 images calibrated (100%), all images enabled | |
|
| Camera Optimization | 0.76% relative difference between initial and optimized internal camera parameters | |
|
| Matching | median of 19589.6 matches per calibrated image | |
|
| Georeferencing | yes, no 3D GCP |  |
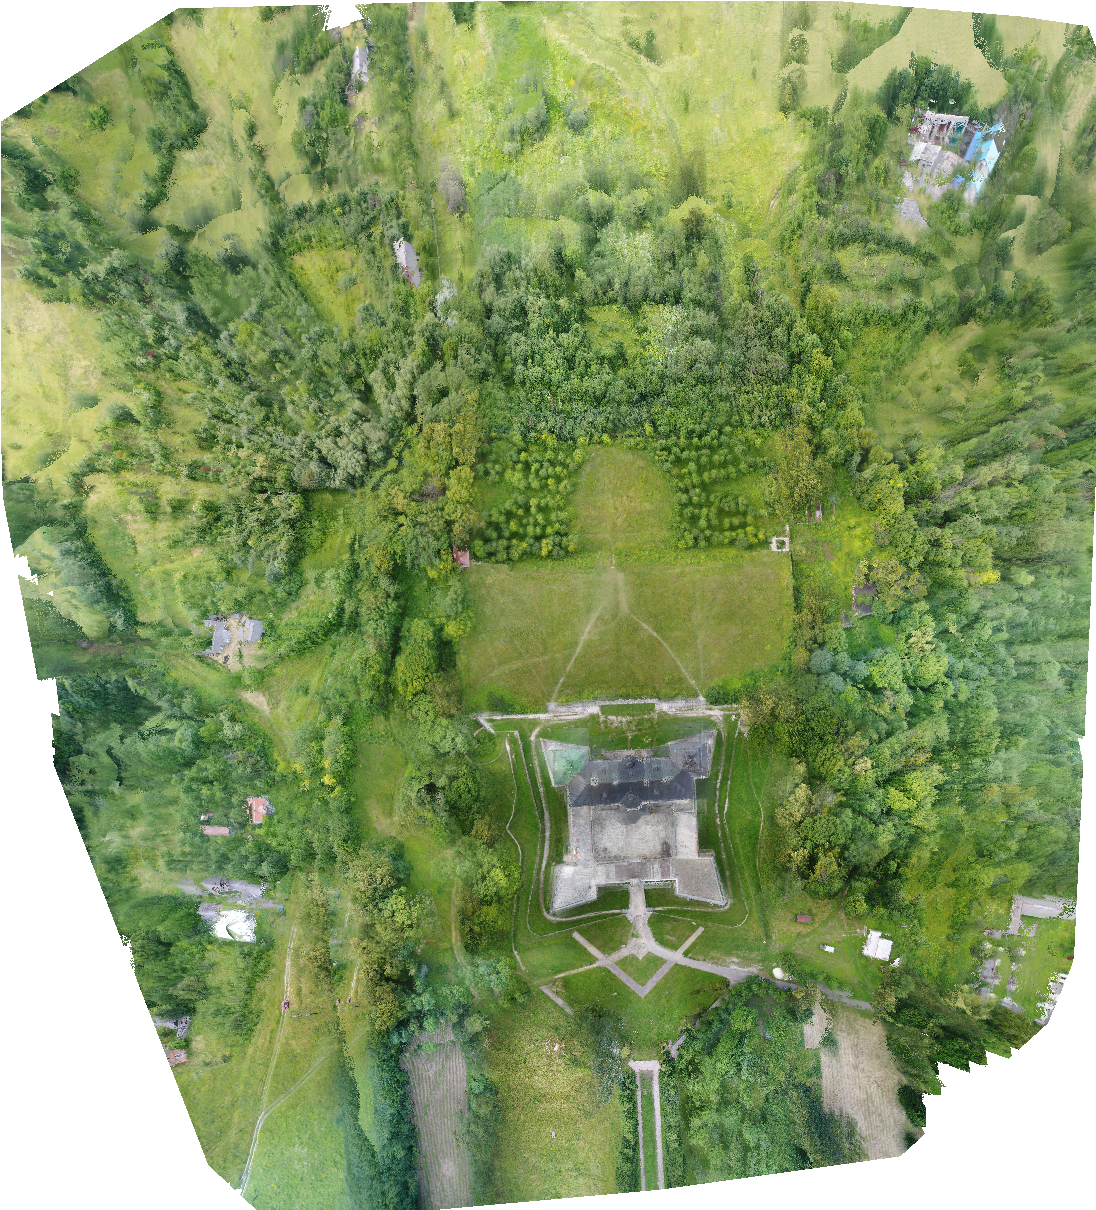
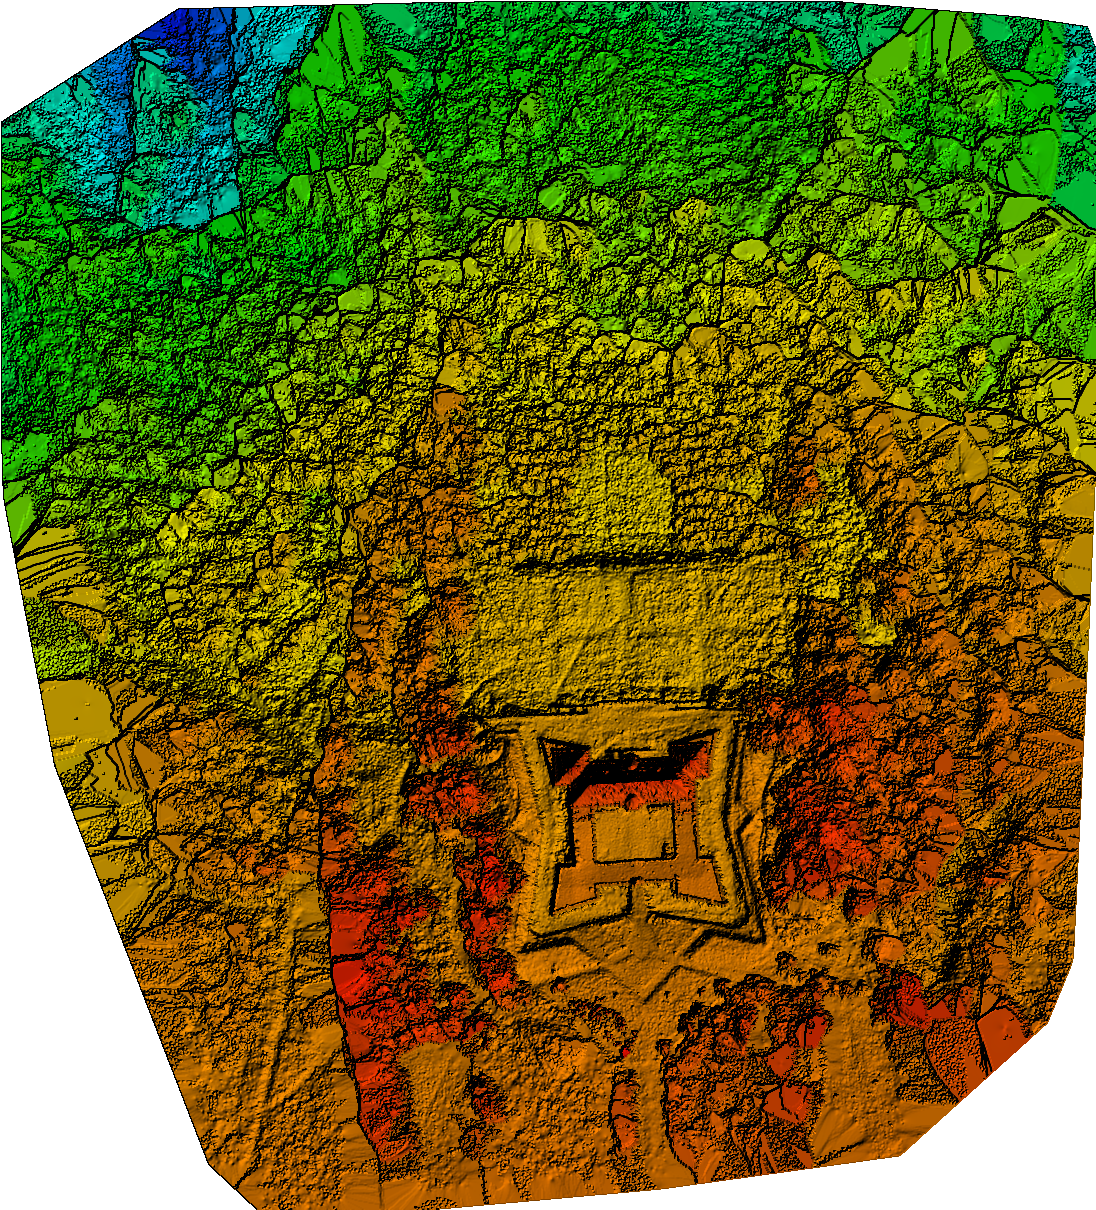
Preview |
Calibration Details |
| Number of Calibrated Images | 282 out of 282 |
| Number of Geolocated Images | 282 out of 282 |
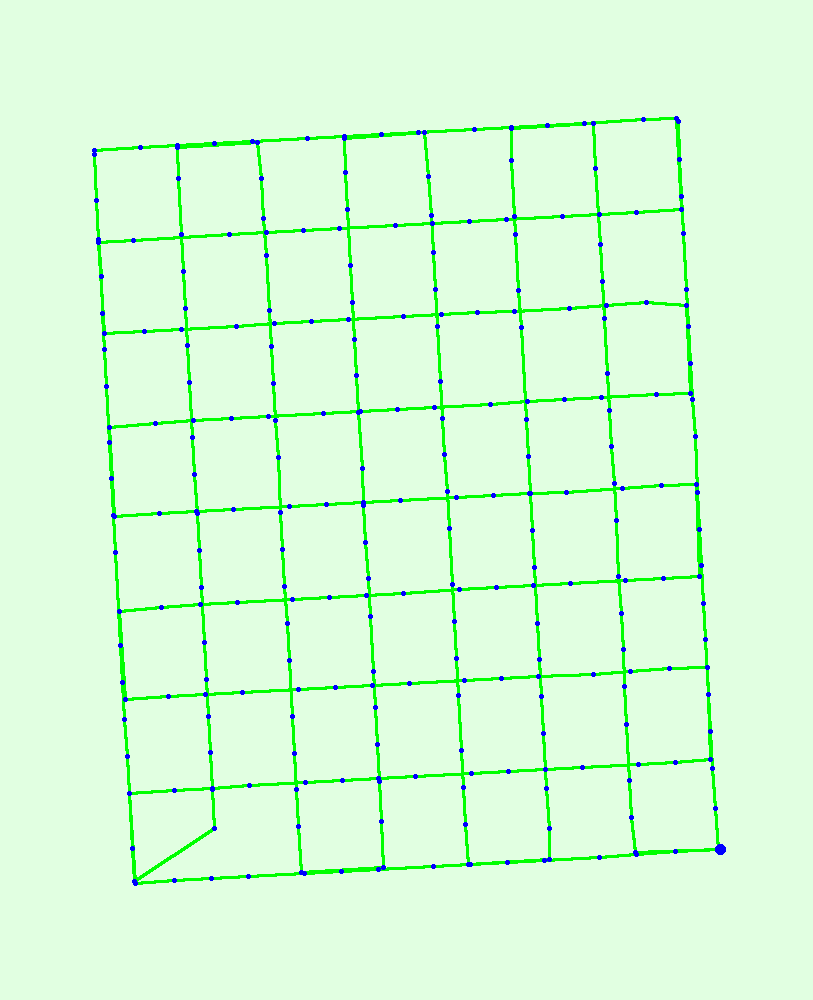
Initial Image Positions |
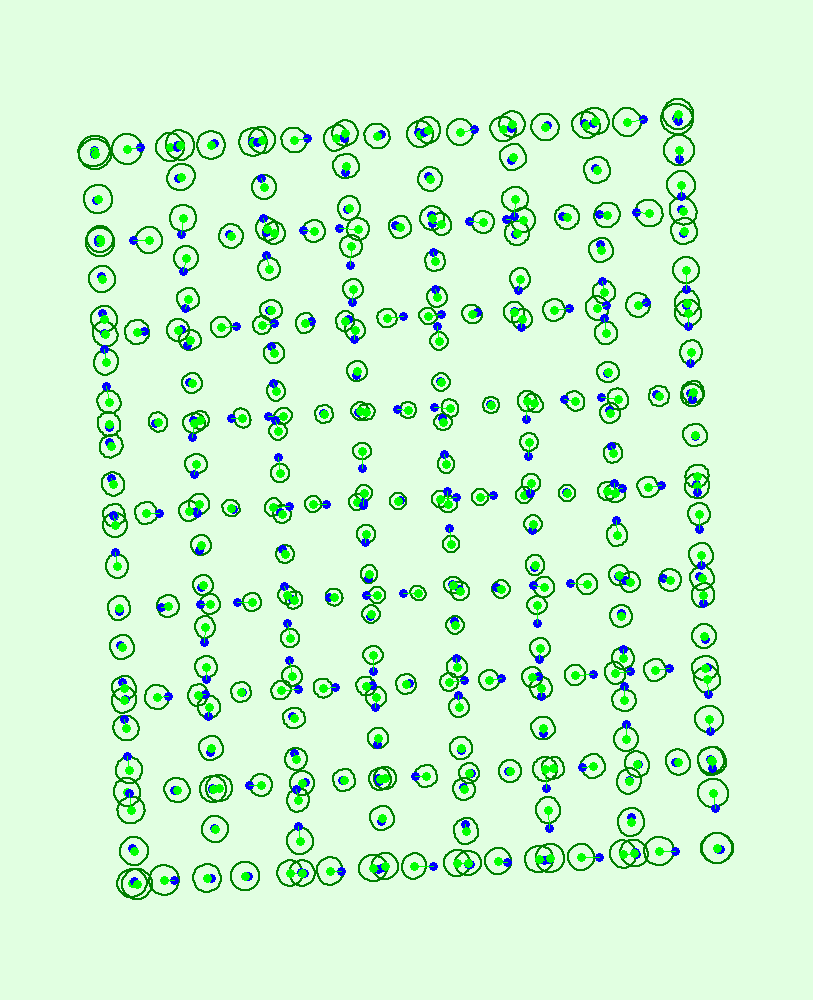
Computed Image/GCPs/Manual Tie Points Positions |
 |
 |
 |
| Uncertainty ellipses 5x magnified |
Absolute camera position and orientation uncertainties |
| X [m] | Y [m] | Z [m] | Omega [degree] | Phi [degree] | Kappa [degree] | |
| Mean | 0.653 | 0.653 | 1.583 | 0.835 | 0.916 | 0.788 |
| Sigma | 0.106 | 0.106 | 0.343 | 0.014 | 0.094 | 0.125 |
Overlap |
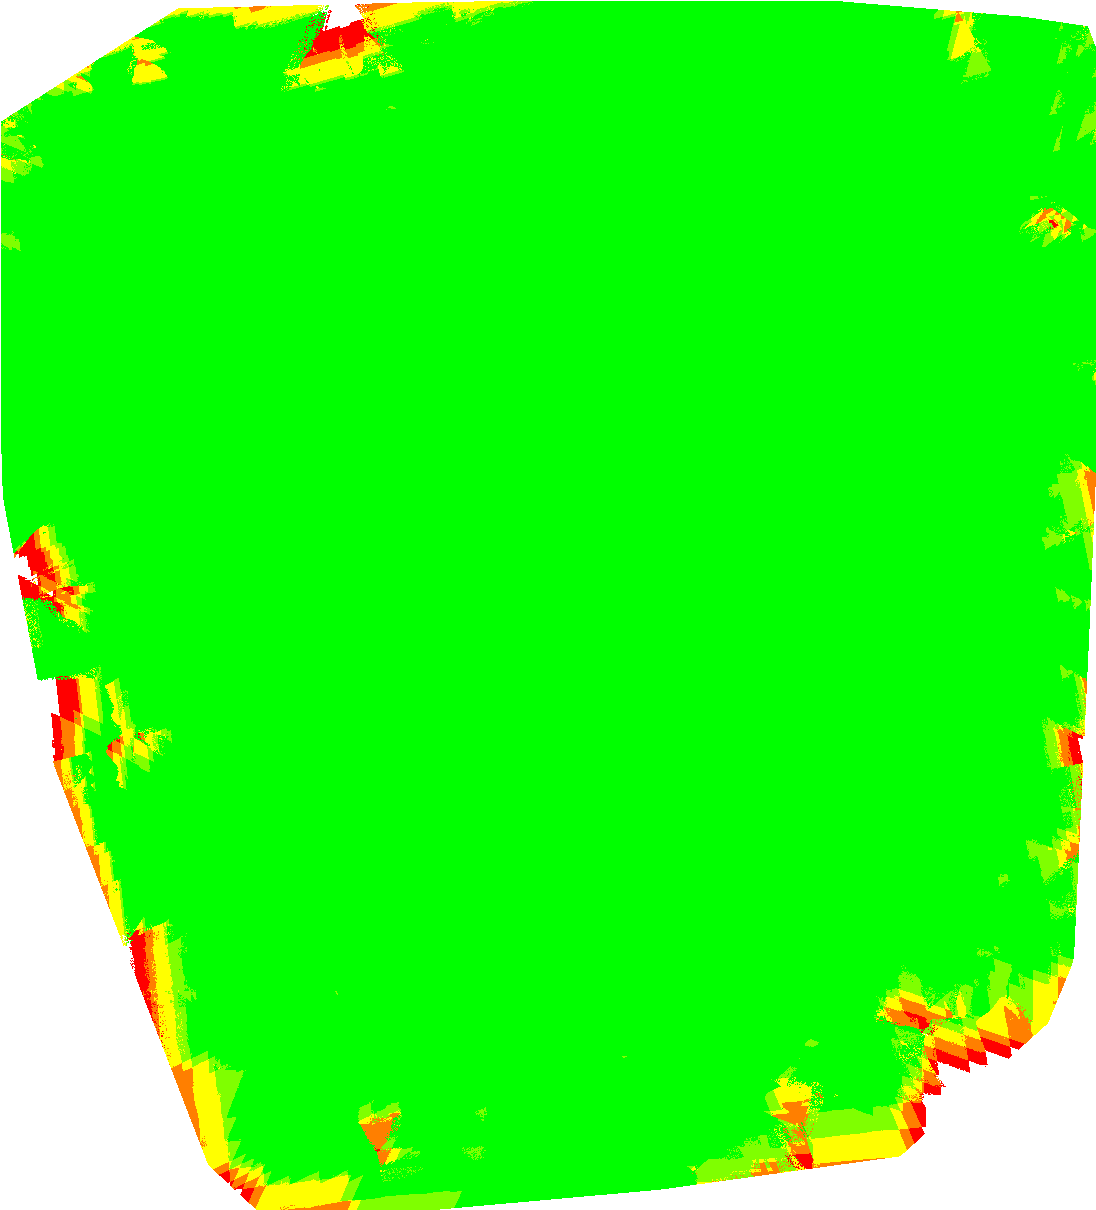
| Number of overlapping images: | 1 | 2 | 3 | 4 | 5+ |
Bundle Block Adjustment Details |
| Number of 2D Keypoint Observations for Bundle Block Adjustment | 5640806 |
| Number of 3D Points for Bundle Block Adjustment | 2289564 |
| Mean Reprojection Error [pixels] | 0.144 |
Internal Camera Parameters |
||
 |
FC6310_8.8_5472x3648 (RGB). Sensor Dimensions: 12.833 [mm] x 8.556 [mm] |
|
EXIF ID: FC6310_8.8_5472x3648 |
| Focal Length |
Principal Point x |
Principal Point y |
R1 | R2 | R3 | T1 | T2 | |
| Initial Values | 3668.759 [pixel] 8.604 [mm] |
2736.001 [pixel] 6.417 [mm] |
1823.999 [pixel] 4.278 [mm] |
0.003 | -0.008 | 0.008 | -0.000 | 0.000 |
| Optimized Values | 3640.817 [pixel] 8.539 [mm] |
2730.076 [pixel] 6.403 [mm] |
1817.809 [pixel] 4.263 [mm] |
-0.003 | -0.007 | 0.007 | -0.002 | -0.000 |
| Uncertainties (Sigma) | 0.783 [pixel] 0.002 [mm] |
0.549 [pixel] 0.001 [mm] |
1.139 [pixel] 0.003 [mm] |
0.001 | 0.002 | 0.002 | 0.000 | 0.000 |
| The correlation between camera internal parameters determined by the bundle adjustment. White indicates a full correlation between the parameters, ie. any change in one can be fully compensated by the other. Black indicates that the parameter is completely independent, and is not affected by other parameters. |
|
|
The number of Automatic Tie Points (ATPs) per pixel, averaged over all images of the camera model, is color coded between black and white. White indicates that, on average, more than 16 ATPs have been extracted at the pixel location. Black indicates that, on average, 0 ATPs have been extracted at the pixel location. Click on the image to the see the average direction and magnitude of the re-projection error for each pixel. Note that the vectors are scaled for better visualization. The scale bar indicates the magnitude of 1 pixel error. |
2D Keypoints Table |
| Number of 2D Keypoints per Image | Number of Matched 2D Keypoints per Image | |
| Median | 68612 | 19590 |
| Min | 42993 | 5210 |
| Max | 83897 | 36194 |
| Mean | 67204 | 20003 |
3D Points from 2D Keypoint Matches |
| Number of 3D Points Observed | |
| In 2 Images | 1702304 |
| In 3 Images | 356032 |
| In 4 Images | 121440 |
| In 5 Images | 53004 |
| In 6 Images | 26216 |
| In 7 Images | 13334 |
| In 8 Images | 7209 |
| In 9 Images | 3894 |
| In 10 Images | 2219 |
| In 11 Images | 1301 |
| In 12 Images | 831 |
| In 13 Images | 552 |
| In 14 Images | 364 |
| In 15 Images | 251 |
| In 16 Images | 173 |
| In 17 Images | 117 |
| In 18 Images | 95 |
| In 19 Images | 70 |
| In 20 Images | 40 |
| In 21 Images | 28 |
| In 22 Images | 25 |
| In 23 Images | 15 |
| In 24 Images | 13 |
| In 25 Images | 6 |
| In 26 Images | 6 |
| In 27 Images | 7 |
| In 28 Images | 4 |
| In 29 Images | 3 |
| In 30 Images | 5 |
| In 31 Images | 1 |
| In 32 Images | 1 |
| In 34 Images | 1 |
| In 39 Images | 1 |
| In 44 Images | 2 |
2D Keypoint Matches |
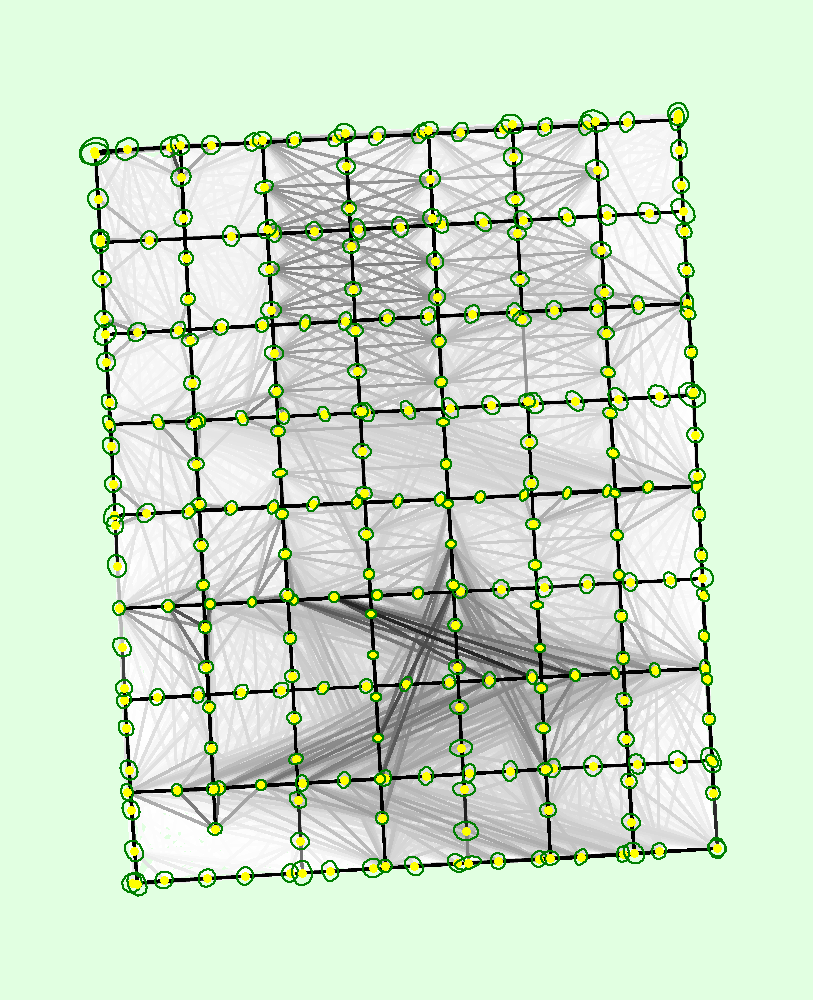 |
 |
 |
| Uncertainty ellipses 100x magnified |
| Number of matches | ||||||||||
| 25 | 222 | 444 | 666 | 888 | 1111 | 1333 | 1555 | 1777 | 2000 |
Relative camera position and orientation uncertainties |
| X [m] | Y [m] | Z [m] | Omega [degree] | Phi [degree] | Kappa [degree] | |
| Mean | 0.022 | 0.022 | 0.023 | 0.021 | 0.019 | 0.019 |
| Sigma | 0.005 | 0.005 | 0.005 | 0.005 | 0.005 | 0.007 |
Geolocation Details |
Absolute Geolocation Variance |
| Min Error [m] | Max Error [m] | Geolocation Error X [%] | Geolocation Error Y [%] | Geolocation Error Z [%] |
| - | -15.00 | 0.00 | 0.00 | 0.00 |
| -15.00 | -12.00 | 0.00 | 0.00 | 0.00 |
| -12.00 | -9.00 | 0.00 | 0.00 | 0.00 |
| -9.00 | -6.00 | 0.00 | 0.00 | 0.00 |
| -6.00 | -3.00 | 6.74 | 9.93 | 0.00 |
| -3.00 | 0.00 | 62.77 | 29.79 | 47.52 |
| 0.00 | 3.00 | 19.50 | 52.84 | 52.48 |
| 3.00 | 6.00 | 10.99 | 7.45 | 0.00 |
| 6.00 | 9.00 | 0.00 | 0.00 | 0.00 |
| 9.00 | 12.00 | 0.00 | 0.00 | 0.00 |
| 12.00 | 15.00 | 0.00 | 0.00 | 0.00 |
| 15.00 | - | 0.00 | 0.00 | 0.00 |
| Mean [m] | 0.000000 | 0.000000 | 0.000000 | |
| Sigma [m] | 1.896506 | 1.973351 | 0.743836 | |
| RMS Error [m] | 1.896506 | 1.973351 | 0.743836 | |
Relative Geolocation Variance |
| Relative Geolocation Error | Images X [%] | Images Y [%] | Images Z [%] |
| [-1.00, 1.00] | 98.58 | 98.23 | 100.00 |
| [-2.00, 2.00] | 100.00 | 100.00 | 100.00 |
| [-3.00, 3.00] | 100.00 | 100.00 | 100.00 |
| Mean of Geolocation Accuracy [m] | 5.000000 | 5.000000 | 10.000000 |
| Sigma of Geolocation Accuracy [m] | 0.000000 | 0.000000 | 0.000000 |
| Geolocation Orientational Variance | RMS [degree] |
| Omega | 2.276 |
| Phi | 2.084 |
| Kappa | 3.532 |
Initial Processing Details |
System Information |
| Hardware | CPU: Intel(R) Core(TM) i5-4570 CPU @ 3.20GHz RAM: 12GB GPU: NVIDIA GeForce GT 755M (Driver: 10.18.13.5582), RDPDD Chained DD (Driver: unknown), RDP Encoder Mirror Driver (Driver: unknown), RDP Reflector Display Driver (Driver: unknown) |
| Operating System | Windows 7 Home Premium, 64-bit |
Coordinate Systems |
| Image Coordinate System | WGS84 (egm96) |
| Output Coordinate System | WGS84 / UTM zone 35N (egm96) |
Processing Options |
| Detected Template |  3D Maps 3D Maps |
| Keypoints Image Scale | Full, Image Scale: 1 |
| Advanced: Matching Image Pairs | Aerial Grid or Corridor |
| Advanced: Matching Strategy | Use Geometrically Verified Matching: no |
| Advanced: Keypoint Extraction | Targeted Number of Keypoints: Automatic |
| Advanced: Calibration | Calibration Method: Standard Internal Parameters Optimization: All External Parameters Optimization: All Lever-Arm Parameters Optimization: None Rematch: Auto, yes Bundle Adjustment: Classic |
Point Cloud Densification details |
Processing Options |
| Image Scale | multiscale, 1/2 (Half image size, Default) |
| Point Density | Optimal |
| Minimum Number of Matches | 3 |
| 3D Textured Mesh Generation | yes |
| 3D Textured Mesh Settings: | Resolution: Medium Resolution (default) Color Balancing: no |
| Advanced: 3D Textured Mesh Settings | Sample Density Divider: 1 |
| Advanced: Matching Window Size | 7x7 pixels |
| Advanced: Image Groups | group1 |
| Advanced: Use Processing Area | yes |
| Advanced: Use Annotations | yes |
| Advanced: Limit Camera Depth Automatically | no |
| Time for Point Cloud Densification | 04h:03m:15s |
| Time for 3D Textured Mesh Generation | 30m:23s |
Results |
| Number of Processed Clusters | 2 |
| Number of Generated Tiles | 3 |
| Number of 3D Densified Points | 36924936 |
| Average Density (per m3) | 71.85 |
DSM, Orthomosaic and Index Details |
Processing Options |
| DSM and Orthomosaic Resolution | 1 x GSD (2.67 [cm/pixel]) |
| DSM Filters | Noise Filtering: yes Surface Smoothing: yes, Type: Sharp |
| Raster DSM | Generated: yes Method: Triangulation Merge Tiles: yes |
| Orthomosaic | Generated: yes Merge Tiles: yes GeoTIFF Without Transparency: no Google Maps Tiles and KML: no |
| Grid DSM | Generated: yes, Spacing [cm]: 100 |
| Raster DTM | Generated: yes Merge Tiles: yes |
| DTM Resolution | 5 x GSD (2.67 [cm/pixel]) |
| Contour Lines Generation | Generated: yes Contour Base [m]: 20 Elevation Interval [m]: 4 Resolution [cm]: 15 Minimum Line Size [vertices]: 20 |
| Time for DSM Generation | 58m:32s |
| Time for Orthomosaic Generation | 12h:34m:51s |
| Time for DTM Generation | 44m:30s |
| Time for Contour Lines Generation | 16s |